Critical thinkers all over the world are wondering…


It appears the COVID 19 cured both the FLU and MEASLES as we haven’t heard a peep about either one!!
According to the CDC for the 2020-2021 flu season, there are some changes to FluView surveillance methodology.
“In previous flu seasons, the NCHS surveillance data were used to calculate the percent of all deaths occurring each week that had pneumonia and/or influenza (P&I) listed as a cause of death. Because of the ongoing COVID-19 pandemic, COVID-19 coded deaths were added to P&I to create the PIC (pneumonia, influenza, and/or COVID-19) classification. PIC includes all deaths with pneumonia, influenza, and/or COVID-19 listed on the death certificate.”
TWO DIFFERENT VIRUSES CODED WITH THE SAME CLASSIFICATION
Influenza (Flu) and COVID-19 are both contagious respiratory illnesses, but they are caused by different viruses. COVID-19 is caused by infection with a new coronavirus (called SARS-CoV-2) and flu is caused by infection with influenza viruses. Because some of the symptoms of flu and COVID-19 are similar, it may be hard to tell the difference between them based on symptoms alone, and testing may be needed to help confirm a diagnosis.
To keep the statistics as muddy as possible it appears they are combining flu with COVID 19 and pneumonia on the death statistics. We certainly don’t want to have accurate figures for our scientists – right?!
There are those who aren’t swept up by propaganda and are desperately trying to filter through the intentionally manipulated data to help determine the risk of this virus. Enter Dr. Frank who says the following on his website:
Sometimes when we don’t understand everything that is going on in a situation, scientists develop “empirical” models. Just pure math that works; no understanding whatsoever. Sometimes we build models that are a mix of what we know and what we don’t. Sometimes we can get away without knowing some things because they average out to being insignificant. The possible approaches are endless, and fun to explore if you are a geek. And great to learn mathematics with, which is why I make my students build a model in calculus class.
So in all this Covid modeling, I’ve deployed all three approaches. And I’ve used common language, with minimal jargon to make it accessible to everyone. And it is working well. You guys are getting it.
https://www.drfrankmodels.com/about
Dr. Frank’s work is part of a long-line of thinkers who look at data, analyze the data into statistics, and use the results to make informed decisions. Our prayer is that it provides comfort and insight. Dr. Frank received a B.A. in Chemistry from Westmont College in Santa Barbara, California.

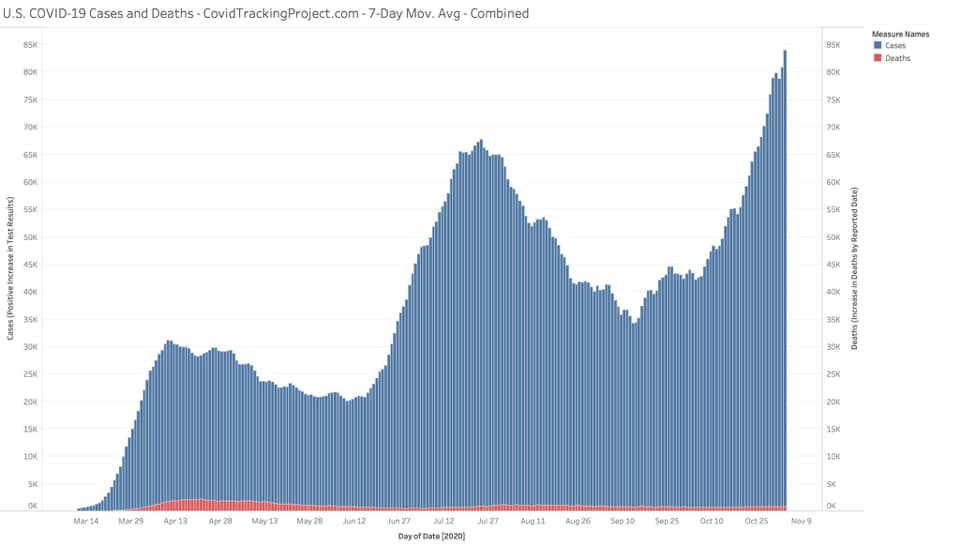
Above is a chart posted by Scott Atlas:
Blue = cases
Red = deaths
…Despite mask mandates having been in effect for months, across the country. If we focus on death rates – even with the convoluted numbers – this isn’t something worth shutting down our country and destroying our freedom.


